1. Linear Interpolation Introduction
Linear interpolation is a method to construct new data points with existing ones. Since antiquity, gaps in
tables have reportedly been filled via linear interpolation, frequently using astronomical data. These
days, math and finance both employ this technique. The estimation of any desired value at a particular
known coordinate point benefits greatly from linear interpolation. It is a method of curve fitting that
uses linear polynomials to plot new data points, which lie in the range of a discrete set of known data
points
1.1. Linear Interpolation in Math
n mathematics, linear interpolation is a curve fitting method that uses linear polynomials to construct
new data points within the range of a discrete set of known ones. Because linear interpolation is helpful
while searching for a value between a given set of points, in math, it is often used as a strategy that
implies using a straight line to connect the given set of points on the positive and negative side of the
unknown point.
1.1.1. Formulas
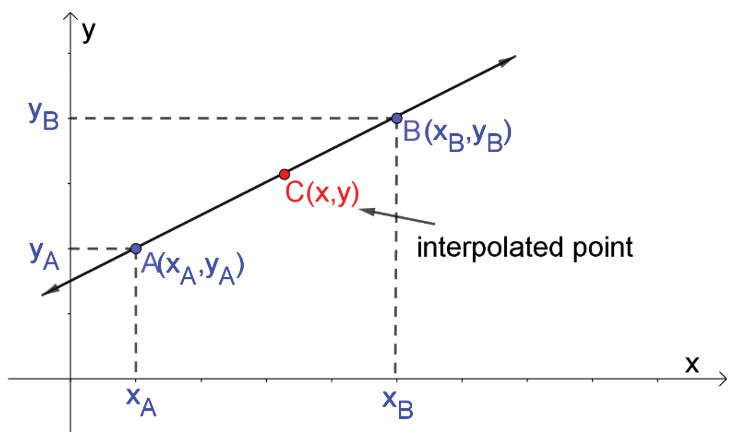
If the two known data points are (a, b) and (c, d) and the linear interpolant (x, y) will be the straight line between (a, b) and (c, d). Let us suppose a<c, then for x in the interval a<x<c, the value y is given
from the equation of slopes:
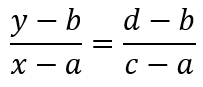
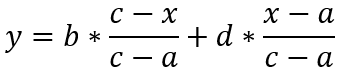
Which can be derived into:
For linear interpolation on a set of data points (x0, y0), (x1, y1), …, (xn, yn) is defined as the
concatenation of linear interpolants between each pair of data points. This results in a continuous
curve, with a discontinuous derivative (in general), thus of differentiability class 
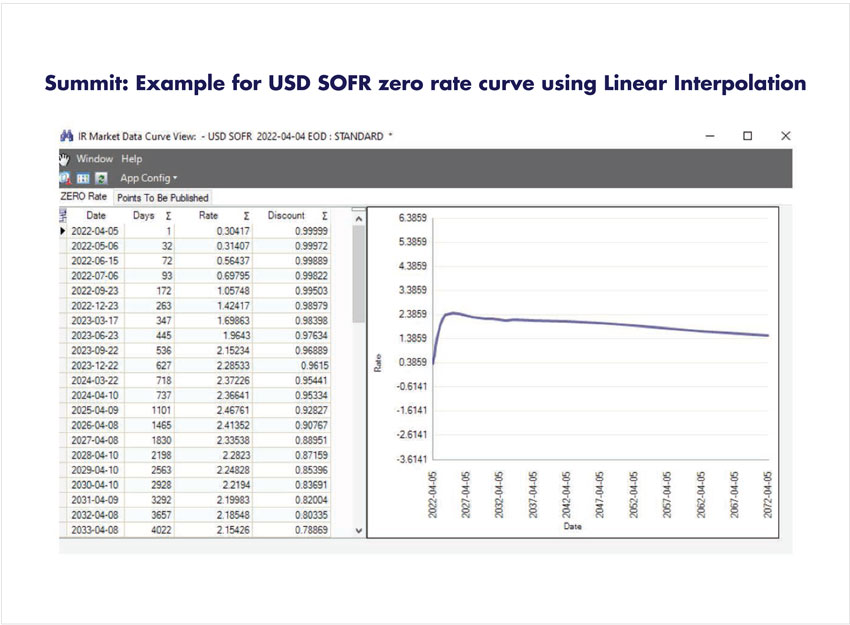
1.2. Linear Interpolation in Summit
In finance, the linear interpolation method is frequently used to generate data points and for curve
fitting. Investors frequently use the Linear Interpolation approach using data from other points to
estimate the value for a point where there is no data.
In Summit, market data calculations and curve construction use the linear interpolation method. When
determining unknown values between existing nodes for term and strike, the system uses Linear
Interpolation logic by default.
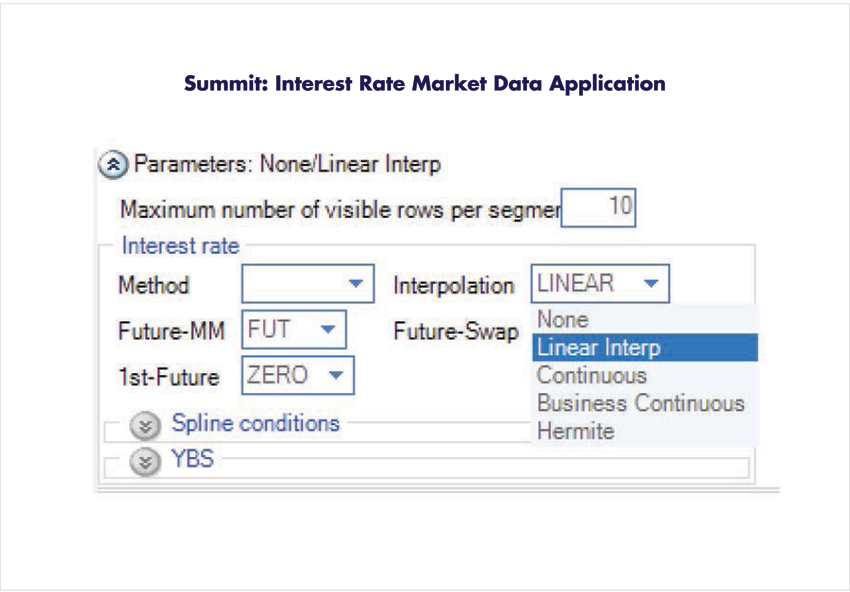
The user can specify the interpolation method used on zero rates by selecting Linear Interpolated in the
Interpolation method Parameter fields of the Interest Rate Market Data Setup.
The options are the following:
- None
- Linear Interpolated
- Continuous
- Business Continuous
1.2.1. Formulas used in Summit
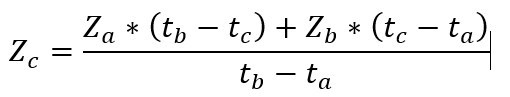
- Summit Zero-coupon rate Calculation
With two known sets of zero-coupon rate and time,  the zero-coupon rate of time c is:
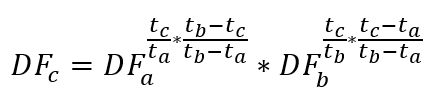
- Exponential Form
Using exponential form of the discount curve, the preceding equation can be expressed using the
discount factor on points A and B.
Solving the previous equation for a time interval, y, results in:

- Summit Discount Factors Calculation
By using the above two equations, we can get a discount factor for point c:

Which can be derived to:
1.2.2. Conclusion
When building curves in Summit, various interpolation methods will be selected based on the
conditions and market data. The advantage of the linear interpolation method is that it is very reliable,
easy to implement, and is usually the starting point for developing yield curve models. The drawback of
this method is that it does not guard against negative forward rates and may have jumps between
forward rates, thus impairing the continuity of the curve. Therefore, users should evaluate and compare
the stability and continuity of curves when selecting interpolation methods for curves by employing
various interpolation techniques.